
Globe.GL
Build an interactive globe with points, arcs and geographic data.
Reference resourceUsage unconfirmed
Turn networks, charts and spatial information into an interactive view.
Browse related referencesUse a globe when geography helps explain a route or relationship. When the shape comes from a mathematical formula, show which parameters change it. Compare references by how easily a visitor can select an item and understand its units, scale and position.
Load a small sample where you know every expected value. Then try a missing value, a repeated location and the largest number in your dataset. Check labels and legends at phone width before increasing the number of points.
These are metadata-based starting points. Runtime behavior, licenses and device support should be checked for your project.
Build an interactive globe with points, arcs and geographic data.
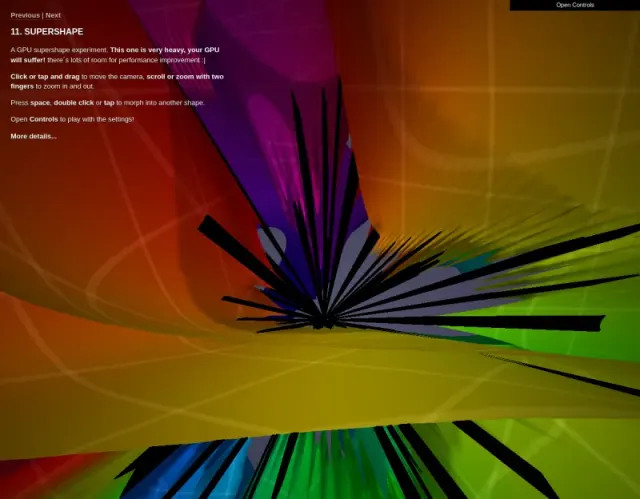
Explore colorful three-dimensional forms made from a mathematical formula.

教用Three.js Points加载渲染点云数据

在3D函数面上对比Standard/Momentum/ADAM收敛

滑动前三band系数、后两band手动输入,提供漫反射/高光/半径三种可视化模式

交互探索Hénon映射混沌与分形结构
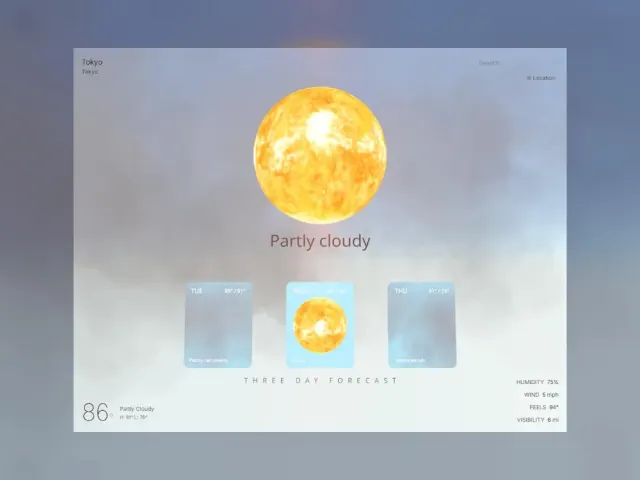
用instancedMesh渲染上千雨滴复用dummy Object3D防GC 60fps

Rainbow Sound Visualization
Related guide · Spatial scenes
References, purchasable packages and creator services have different scopes. Check the individual offer.
There are no matching published offers yet. You can describe your project or apply to share your own work.